Spring 2013 Q8

- What does it mean when it says to assume 6 month reporting periods and how does that change our trend period selection? For the historical period, I thought that it ends in the AAD of most recent available data point period aka April 15 2012. I also thought that the end of the projected trend period should be January 1 2014 since we have ANNUAL policies with ANNUALLY revised rates.
- Why are we using the 8 point trend for freq and sev for the historical trend selection? I saw someone ask a similar question in one discussion post but I would like to ask for more clarification. I thought that the historical trend selection should reflect the trends from the past while the FUTURE trend selection is where we reflect more recent data under newer trends. As such, for the historical trend selection I was thinking of using the 12 points trends.
Comments
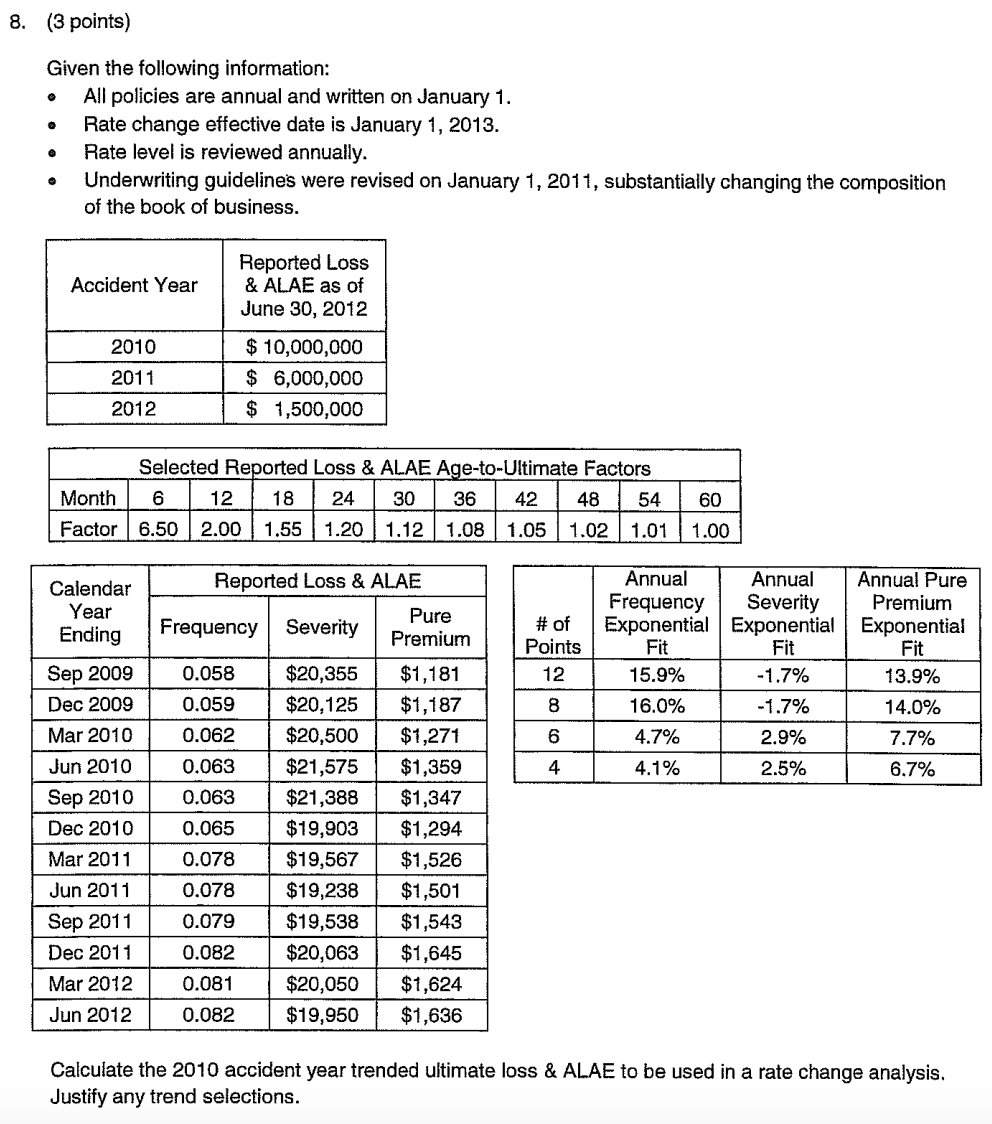
First note that all policies are annual and are written on Jan 1. That means the average accident date for AY 2010 is Jun 30, 2010. (Not Jan 1, 2011, which it would be if policies were written uniformly over the whole year.)
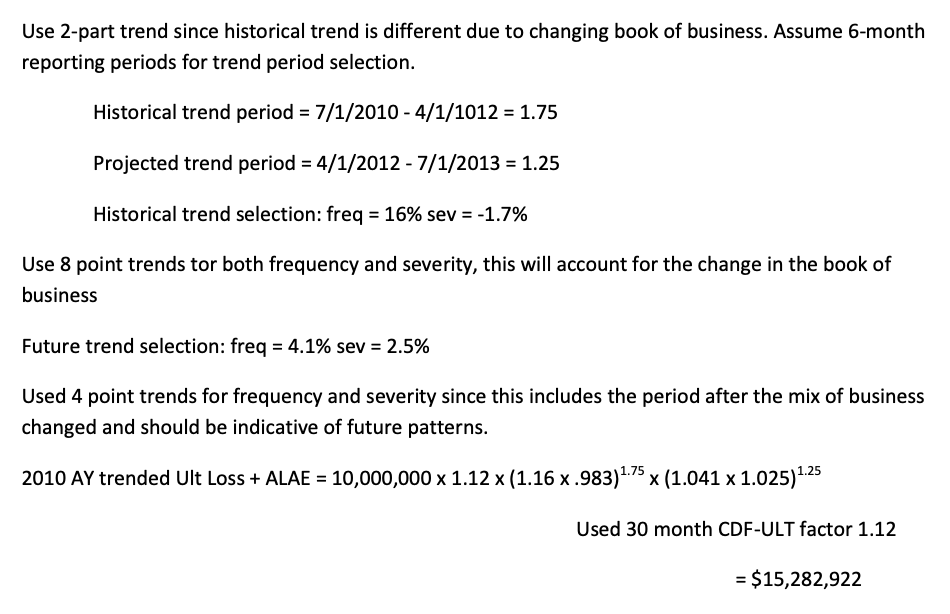
The solution in the examiners' report is not a good solution. The reason it is not a good solution is that they used the 8-point exponential fit for step 1 of the 2-step trending. This is not valid because the 8-point fit uses data from before and after the change in composition of the book of business.
A better solution is to make an adjustment to the latest pure premium before the change (CY ending Dec 2010) to bring it up to current pure premium levels:
The adjustment factor for AY 2010 losses is then $1,636 / $1,294 = 1.2643
Using the appropriate LDF for AY 2010 (which is the 30-ultimate factor) gives us
But we still have to apply the trend to bring the above value from the average accident date for CY ending Jun 2012 to average accident date of the effective period:
This is 1.5 years. You can now use the 4-point exponential trend fits from the given table because the 4-point fit uses data after the change in composition so should be accurate going forward. Putting this all together gives a final result of:
Why is the AAD of the effective period = Jun 30 2013 used? I thought that for losses, since rate level is reviewed annually and policies are annual, the AAD for losses during PY effective period should be Jan 1 2014. (Whereas for premium trends, we take the AAD of the effective period and get June 30 2013.)
Also, in the solution, their projected trend period starts on April 1 2012 so they are taking the AAD assuming 6 month data periods? And the solution also has 7/1/2013 which I am unsure how the projected trend period ends here. Thank you.
Q1: Why is the AAD of the effective period = Jun 30 2013 used?
Q2: Also, in the solution, their projected trend period starts on April 1 2012 so they are taking the AAD assuming 6 month data periods?
Q3: And the solution also has 7/1/2013 which I am unsure how the projected trend period ends here.
That clears it up, thank you!
You're welcome!
*I am having some trouble understanding how using the long-term trend might not be as accurate mathematically. I understand how using the pure premium adjustment factor obviously brings it to the current level very accurately, so it would be more helpful to get an explanation for why the exponential fit is not as accurate.
Question 1:
Question 2:
I'm not sure I understand your last question. Are you asking for the reason for my alternate trend calculation (see earlier post) versus the official solution of using the exponential fit? The exponential fit used for Step 1 trending incorporates data from both before and after the change so it's likely that the true trend from before the change was greater than shown in the exponential table.
As a side note, this problem is from 2013 and I don't think it was a particularly good problem because there are too many valid interpretations that are different from the official answer. The more recent exam problems are likely a better indicator of the type of problem you can expect on your own exam.