Fall 2016 Q12

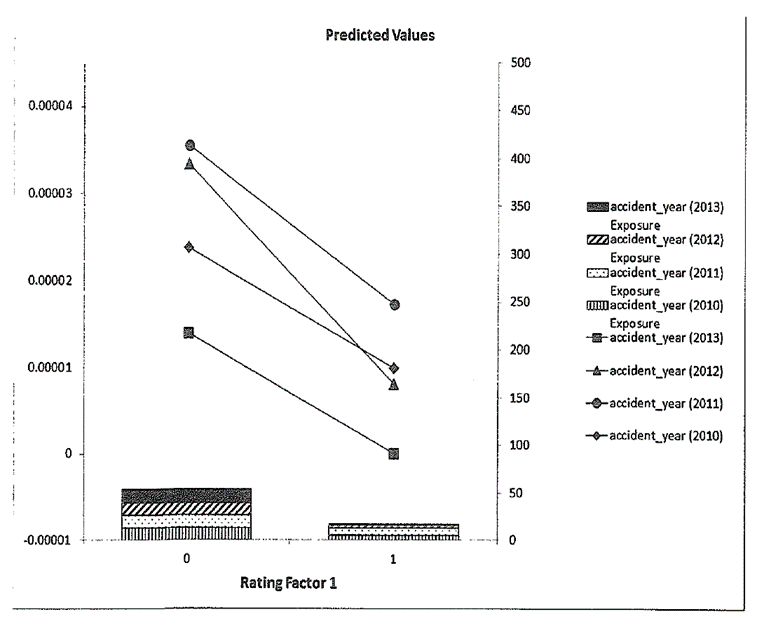
Hi, is the left axis meant to be the natural log of the relativity and the right axis meant to be exposures? If the vertical axis is close to zero, should we assume it's the natural log of the relativity?
It looks like you're new here. If you want to get involved, click one of these buttons!
Hi, is the left axis meant to be the natural log of the relativity and the right axis meant to be exposures? If the vertical axis is close to zero, should we assume it's the natural log of the relativity?
Comments
Actually, I don't know what the scale on the left axis represents. If it were the natural log of the relativities then the relativities would be e^0.00001, e^0.00002, and so on, but those would be way too close to 1.0000 to be meaningful. Also, none of the relativities would be less than 1.0 which also doesn't make sense.
From the answer given in the examiners' report, you didn't have to interpret any of the actual numbers. They just wanted you to notice the steep slope of the lines and then conclude that the variable should be included.
Note that the exposures also seem very low, assuming the right-hand axis represents exposure level, which doesn't really make any sense unless the right-hand axis is in 000s.
All in all, this was not a well-constructed problem. I wouldn't spend too much time trying to figure out what they meant. Most of the multivariate graph problems are pretty straightforward so if you write something half-way intelligent in your response, you should get credit. I'm sure you've looked at the other old exam problems of this type and they are all pretty similar (and not too hard) so don't get too hung up this one. 😏