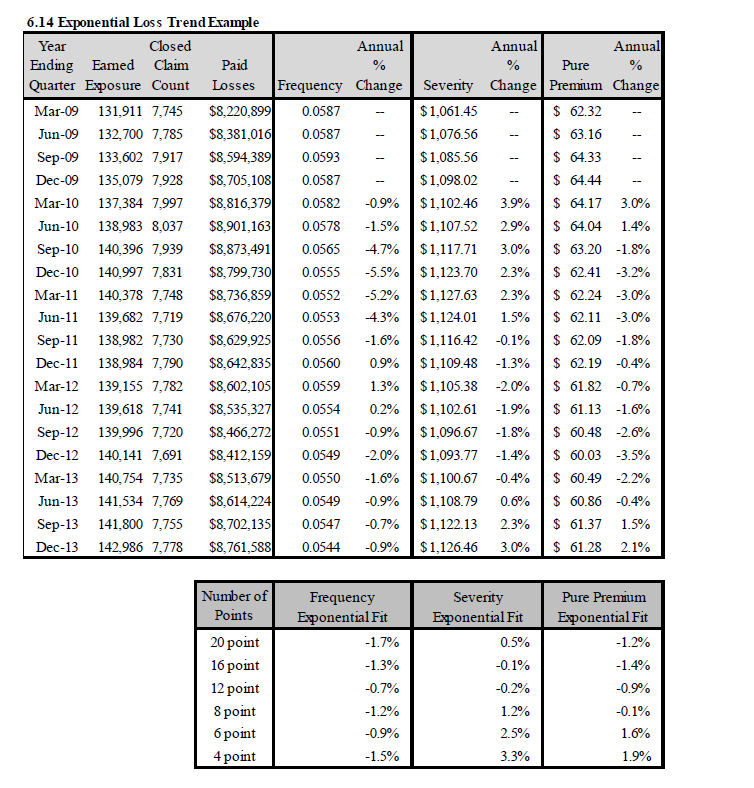
Exponential curve fit for loss trends

Could you please explain what excel functions/calculation should I use to get to the freq/severity exponential fits in the Werner's textbook example in page 111, with a screenshot attached below. I tried to use the "LOGEST" function to fit exponential curve, but the fit result is not what's shown in the example. (I know this is not going to be tested, and am just trying to understand what's going on under the hood). Thanks in advance.
Comments
Here is what I got using the LOGEST function. My calcs matched the table in Werner. I tested it for severity and pure premium also: