Unwinding of discount

Can you provide a numerical example where we are asked to calculate unwinding of discount using "constant yield curve" and "unwinding using spot rates"?
It looks like you're new here. If you want to get involved, click one of these buttons!
Can you provide a numerical example where we are asked to calculate unwinding of discount using "constant yield curve" and "unwinding using spot rates"?
Comments
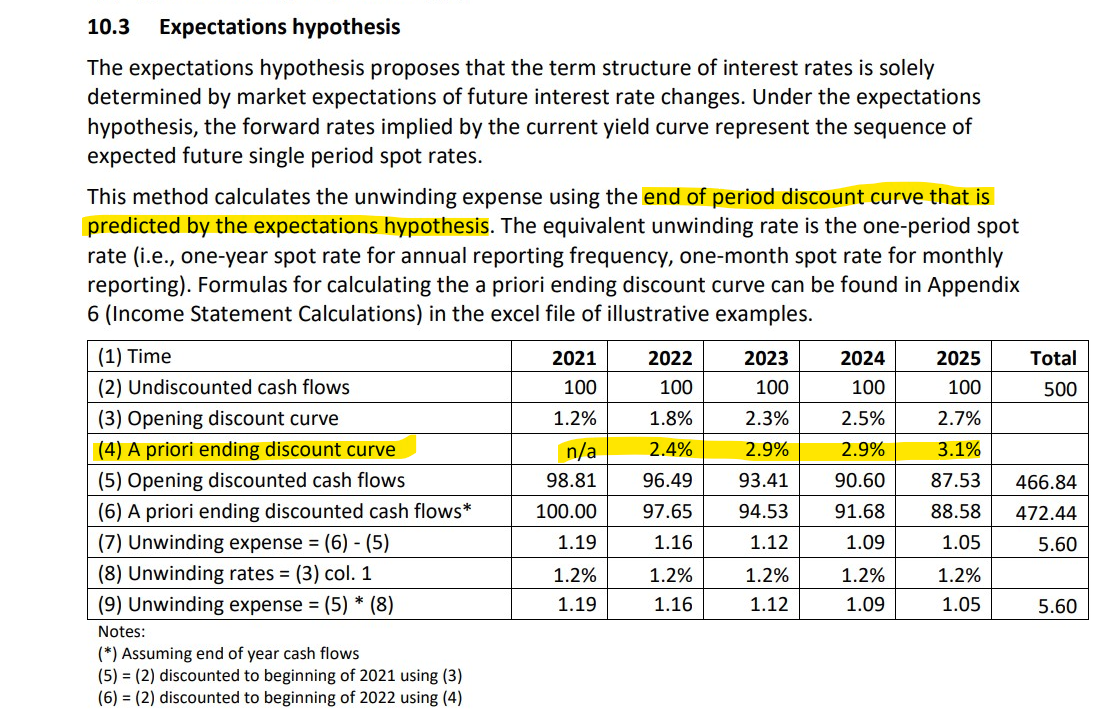
The source provides a table with a numerical example on page 28 which shows exactly what you are asking for")
Will the a priori ending discount curve for expectations hypothesis be given to us on the exam, or is there a way to derive it from the opening discount curve?
Have you tried taking a look at the sample excel calculation?
Where can I find the link to the appendices 6 and 7? Can't find appendices 6 and 7 on the CIA website but 8 and 9 are there. Thanks!
Complex with OCI: "https://www.cia-ica.ca/publications/222159woe/"
Simple without OCI: "https://www.cia-ica.ca/publications/222159be/".
Thank you!
Hi,
I couldn't find in any excel sheet the formula for calculation the highlighted rate, could you please tell what's the explicit formula for this please?
You can check number 13 in the sample IFRS17 questions. I did the calculations in Excel for the unwinding of discount according to the expectations hypothesis