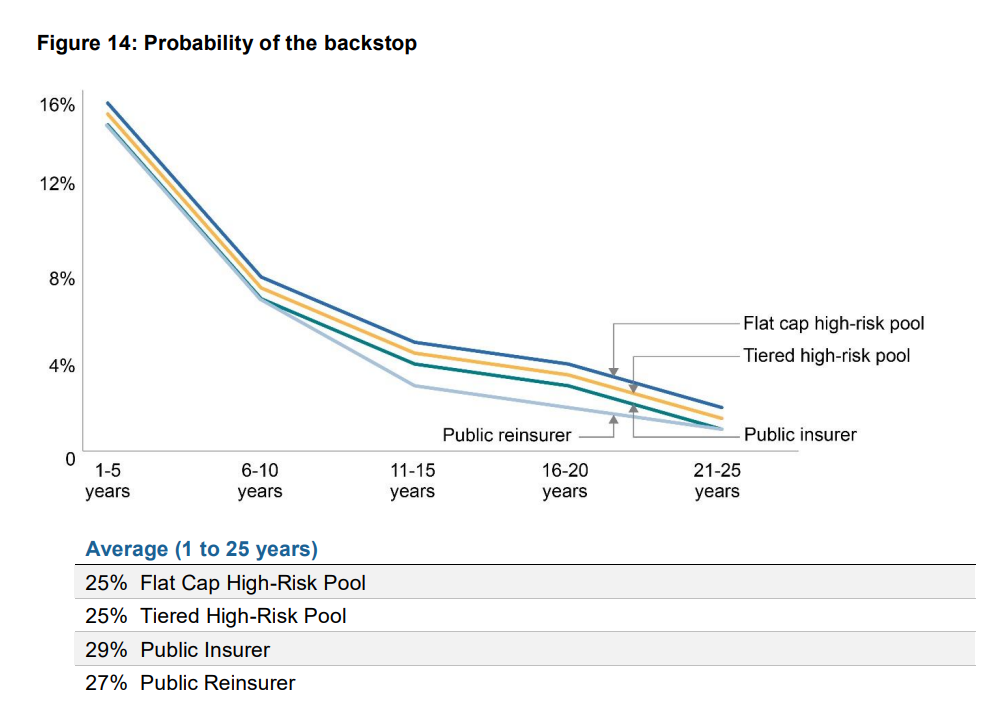
Probability of use of backstop

According to the graph, it looks like flat cap has the highest probability of use of the backstop, however in the table, it has the lowest %. Am I misinterpreting something?
It looks like you're new here. If you want to get involved, click one of these buttons!
According to the graph, it looks like flat cap has the highest probability of use of the backstop, however in the table, it has the lowest %. Am I misinterpreting something?
Comments